Diving Into the Data: A Closer Look at Analytics and What They Mean for Your Business
One of the reasons I love working with product-based businesses is the fact that they have so much data. They know their customers, they know what they’re buying and not buying, and they can leverage that data to make smart decisions for their business. Recently, I was hired by a group of product-based businesses to dive into all things Google Analytics. Here are some of the most valuable nuggets we discovered.
Why do we even look at data?
Most of us want to increase profits, and a great way to do that is by driving sales. Of course, you can also decrease expenses or change your product/channel mix, but I digress. Looking at your analytics will help you to attract more visitors, increase your conversion rate, and generate more sales. When it comes to driving sales online, I try and focus on this basic formula:
Visitors x Conversion Rate X Average order Size (AOS) = $ales
Let’s look at an example:
1000 visitors x 3% conversion rate x $35 AOS = $1,050
To improve this, you can do a variety of things. But without looking at the data, it’s hard to know…
- What can be improved
- If the changes you make are actually working
Here are 3 things you can do to impact sales and how the formula changes when you do this:
- Drive more traffic – 2000 visitors x 3% conversion rate X $35 AOS = $2,150
- Improve the conversion rate by increasing the quality of traffic or by making the shopping experience easier – 1000 visitors x 4% conversion rate x $35 AOS = $1,400
- Increase prices or basket size with suggested products or bundles – 1000 visitors x 3% conversion rate X $45 AOS = $1,350
Now imagine if you do all 3 at the same time…
2000 visitors x 4% conversion rate X $45 AOS = $3,600
Analytics for E-Commerce Businesses
If you’re running a product-based business that is selling online, you’re likely using an E-commerce platform such as Shopify. Just like anything, there are pros and cons when it comes to looking at Google Analytics versus analytics within a platform like Shopify.
Pros of Shopify
- Easy to use
- No additional setup or codes to enter
- Provides an overview and essential data
Cons of Shopify
- Limited ability to drill down
- Data stays in Shopify
- Data limited based on plan
Pros of Google Analytics
- More metrics available
- Greater ability to drill down
- Detailed and customized for your specific needs
Cons of Google Analytics
- Requires some know-how
- The amount of data can be overwhelming
- Takes an extra step to set up
Embracing the Data
To generate the biggest impact from your marketing analytics, think about this marketing funnel to better understand your customers. It will help you determine where your customers are coming from, their activity while on your site, and who is taking action.
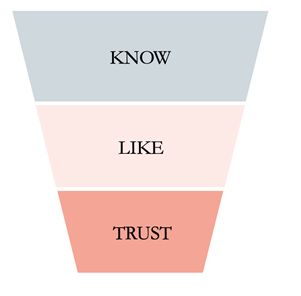
- Where are they coming from? (Know)
- What are they doing on the site? (Like)
- Who is taking action? (Trust)
The ABCs of Google Analytics
The beauty of Google Analytics is that it is structured just like this funnel, they just use different terminology – ABCs.
- Acquisition in Google Analytics tells us where visitors come from and where they get to know us.
- Behavior in Google Analytics tells us what they are doing on the site. What pages, products, and blogs do they interact with, and how much do they like what they see?
- Conversion tells us who is taking action and how much they trust in us by buying our products or taking the next step, such as signing up for a newsletter or completing a form.
Digging Deeper
In my next post, I will show you some specifics within Google Analytics that can impact these 3 levels of the funnel and how you can change what you are doing to drive sales. In the meantime, I encourage you to do 3 things ASAP:
- Set up Google Analytics (UA) on your website
- Set up Google Analytics 4 (GA4) on your website – this is a newer version of UA that focuses on active users instead of total users. In June 2023, this new version (which is event-based rather than cookie-based like UA) will take over, and you’ll want to start tracking your data today. I will be sharing more about GA4 as we get closer, but here’s an IG stories video I did that explains the change in more detail.
- Turn on Enhanced Ecommerce – this only applies if you sell products on your website. Here’s another video on how and why this step is so important.
For additional information, you can view more of my data-related blogs here!
Here at Ellen Grace, we work with many product-based clients and ONLY look at their data. On a monthly or quarterly basis, we can dive into your analytics and help you make impactful decisions for your business. Analytics packages are affordable and can be tailored to your specific needs. Book a call to learn more!